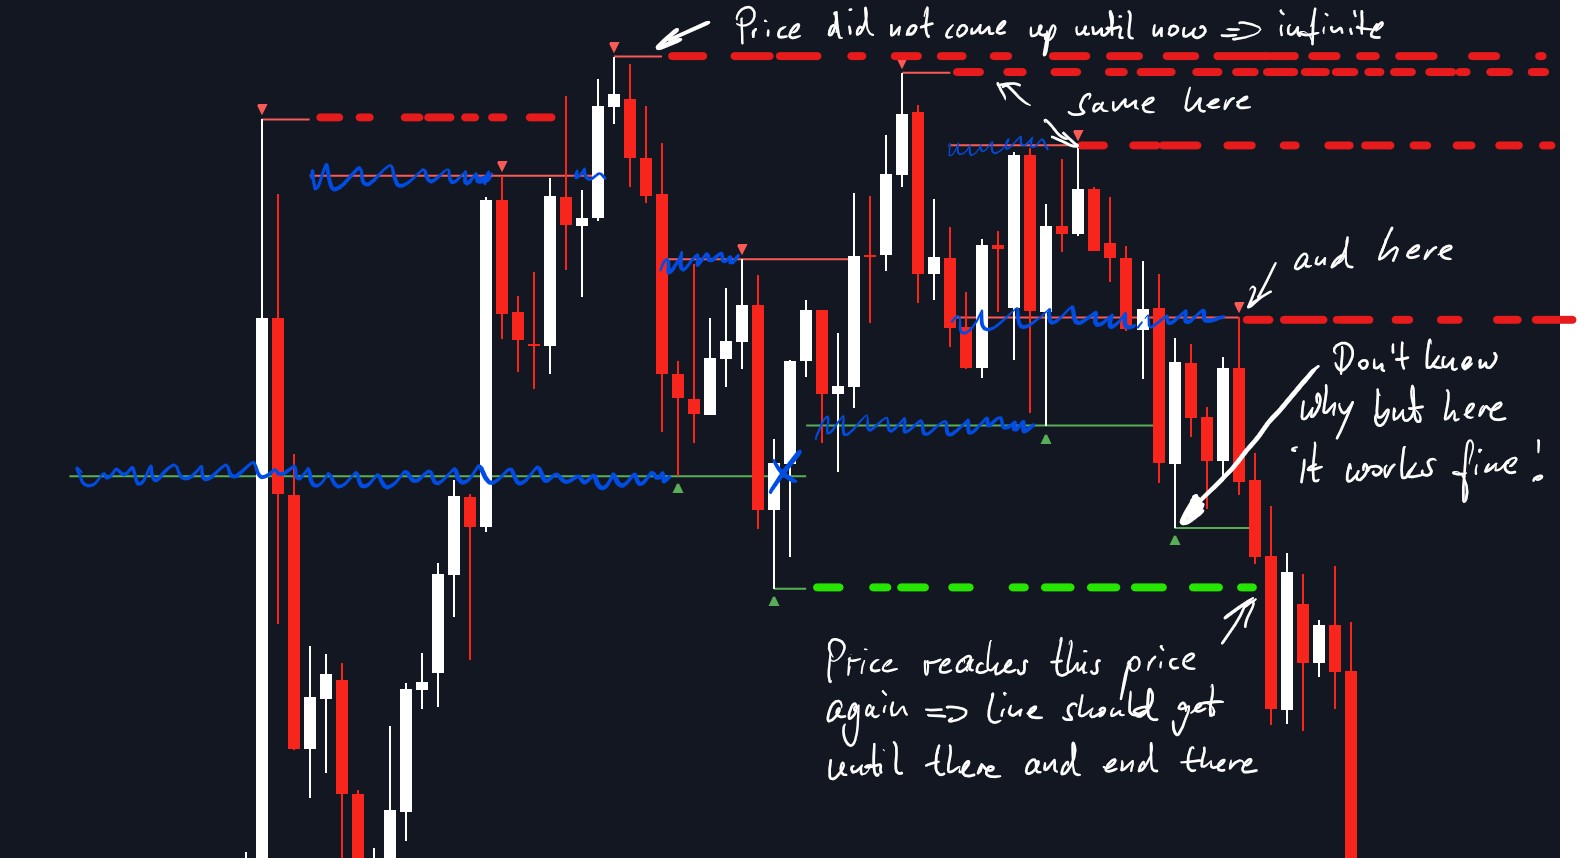
I need help with the following code. So I want to draw a horizontal line from every Pivot low or high until the price breaks through this levels then the line should be interrupted.
I've two problems with the following code:
1. It just draws horizontal lines from the last few pivot points and not from the historical ones.
2. The lines are not correctly aligned and partially point into the past.
hope somebody can help me.
Code: Select all
//@version=5
indicator("Fractals with horizontal lines", overlay=true)

//detecting the pivot highs and lows
ph = ta.pivothigh(3, 3)
pl = ta.pivotlow(3, 3)

//Indicates at which candle a pivot high was created
when_occure_high = ta.valuewhen(ph, bar_index, 0)

//Indicates at which candle a pivot low was created
when_occure_low = ta.valuewhen(pl, bar_index, 0)

//Indicates the price of this pivot high
high_value = ta.valuewhen(ph, high[3], 0)

//Indicates the price of this pivot low
low_value = ta.valuewhen(pl, low[3], 0)

//should return the values x2 (horizontal endpoint) for the line
price_cross_high    = int(ta.valuewhen(ta.cross(high_value, high), bar_index, 0))
price_cross_low     = int(ta.valuewhen(ta.cross(low_value, low), bar_index, 0))

//A horizontal line is drawn for each pivot high and pivot low
line_high = line.new(when_occure_high-3, high_value, price_cross_high, high_value, color=color.red)
line_low = line.new(when_occure_low-3, low_value, price_cross_low, low_value, color=color.green)

plotshape(pl, style=shape.triangleup, color=color.green, offset=-3, location=location.belowbar)
plotshape(ph, style=shape.triangledown, color=color.red, offset=-3, location=location.abovebar)